Spreading the Wealth
We hear a great deal about distribution of wealth in the news these days. So just how is it spread?

Well, the top 1% of the population owns a third of the total wealth and nearly 40% of the financial wealth. Meanwhile, the bottom 80% (representing 80 times as many people as the top 1%) own only a sixth of the total wealth and less than 10% of the financial wealth.

These are the forms in which the wealth is spread.

Publicly traded corporations account for about 85% of business revenues. Here is who owns the stock in these corporations.

Income is a important means of wealth building. Here's how income from all sources is distributed.

And, here's the distribution of capital income.

The same thing in graphical form covering the "Reaganomics" (economic trickle-down) years.

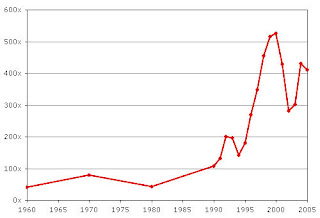
We hear a great deal about the growth of CEO compensation. Here's the average "Joe the CEO" compensation in thousands of dollars.

Here are the trends in compensation for various groups expressed in constant dollars (adjusted for inflation).
Now, in a change of pace, here are some statistics on distribution of wealth by non-financial groups.

Here is how the wealth stacks up by ethnicity and race on a household basis.

And, finally, here's how we stack up against our cousins in the European Union.

Well, the top 1% of the population owns a third of the total wealth and nearly 40% of the financial wealth. Meanwhile, the bottom 80% (representing 80 times as many people as the top 1%) own only a sixth of the total wealth and less than 10% of the financial wealth.

These are the forms in which the wealth is spread.

Publicly traded corporations account for about 85% of business revenues. Here is who owns the stock in these corporations.

Income is a important means of wealth building. Here's how income from all sources is distributed.

And, here's the distribution of capital income.

The same thing in graphical form covering the "Reaganomics" (economic trickle-down) years.

We hear a great deal about the growth of CEO compensation. Here's the average "Joe the CEO" compensation in thousands of dollars.

Here are the trends in compensation for various groups expressed in constant dollars (adjusted for inflation).
Now, in a change of pace, here are some statistics on distribution of wealth by non-financial groups.

Here is how the wealth stacks up by ethnicity and race on a household basis.

And, finally, here's how we stack up against our cousins in the European Union.

Comments
Post a Comment